As a beginning data scientist coming from a systems background, i am always into seeing how fast stuff runs and comparing methods to learn the most efficient way.
I recently wrote a python script that will run twenty tests. Each test generates a random data file (random number of lines multiplied by 100,000) with a random number of columns , and then uses pandas, dask, pyspark, and then native python code to benchmark how long it takes to load the file and then get the mean for the first column. When it is done, it loads the results into a Big Query database as well as generates a plot to show the values.
The code is all in a Github repo- https://github.com/scottstef/pandas_benchmarking if you want to play along at home. Rather than post lines of code, I will briefly describe what each package does and the functions in it. Please feel free to clone the code and look at it to follow along better.
Lets walk thru the code!
Main.py
The main.py is a basic driver. The first lines are importing python libraries and imports the packages i wrote. Main has a save_benchmark_results function that will save the benchmark results after the code has been run, and saves it to both a local sqlite database and a big query database.
Main then goes ahead and initialized the databases, creates a random seed for the data generation, identifies if a test flag is passed (the test flag runs a single test, with a 100,000 row x 10 column data file)
Main then generates the data file and prints the size of it. It then runs the benchmark tests, loads the results into a sqlite and bigquery database, creates a cumulative plot of the results, and then prints out an average of all tests from the data in big query.
Benchmarks packages
These four scripts run the benchmark test (pandas, dask, pyspark, and native python code) to load the data file, get the mean of the first column of the file, and return the times that each process took.
Data/Generator package
This package simply pulls the number of rows and columns from main and generates a csv file of data. To add size to the file, I multiplied the count time 100,000 to deal with significant files. Being honest, I originally was multiplying the count by 1 million, but my code kept crashing when pyspark ran or when the native python test ran.
Storage Packages
There are two packages in here, bigquery_manager.py and sqlite_manager.py These each simply create, initialize, import results into their respective database, and the performs queries as needed.
Visualization/plotter.py
This is a simple plotting script. It pulls data from the sqlite data base, so it will be local results only. It then creates a basic graph.
Results???
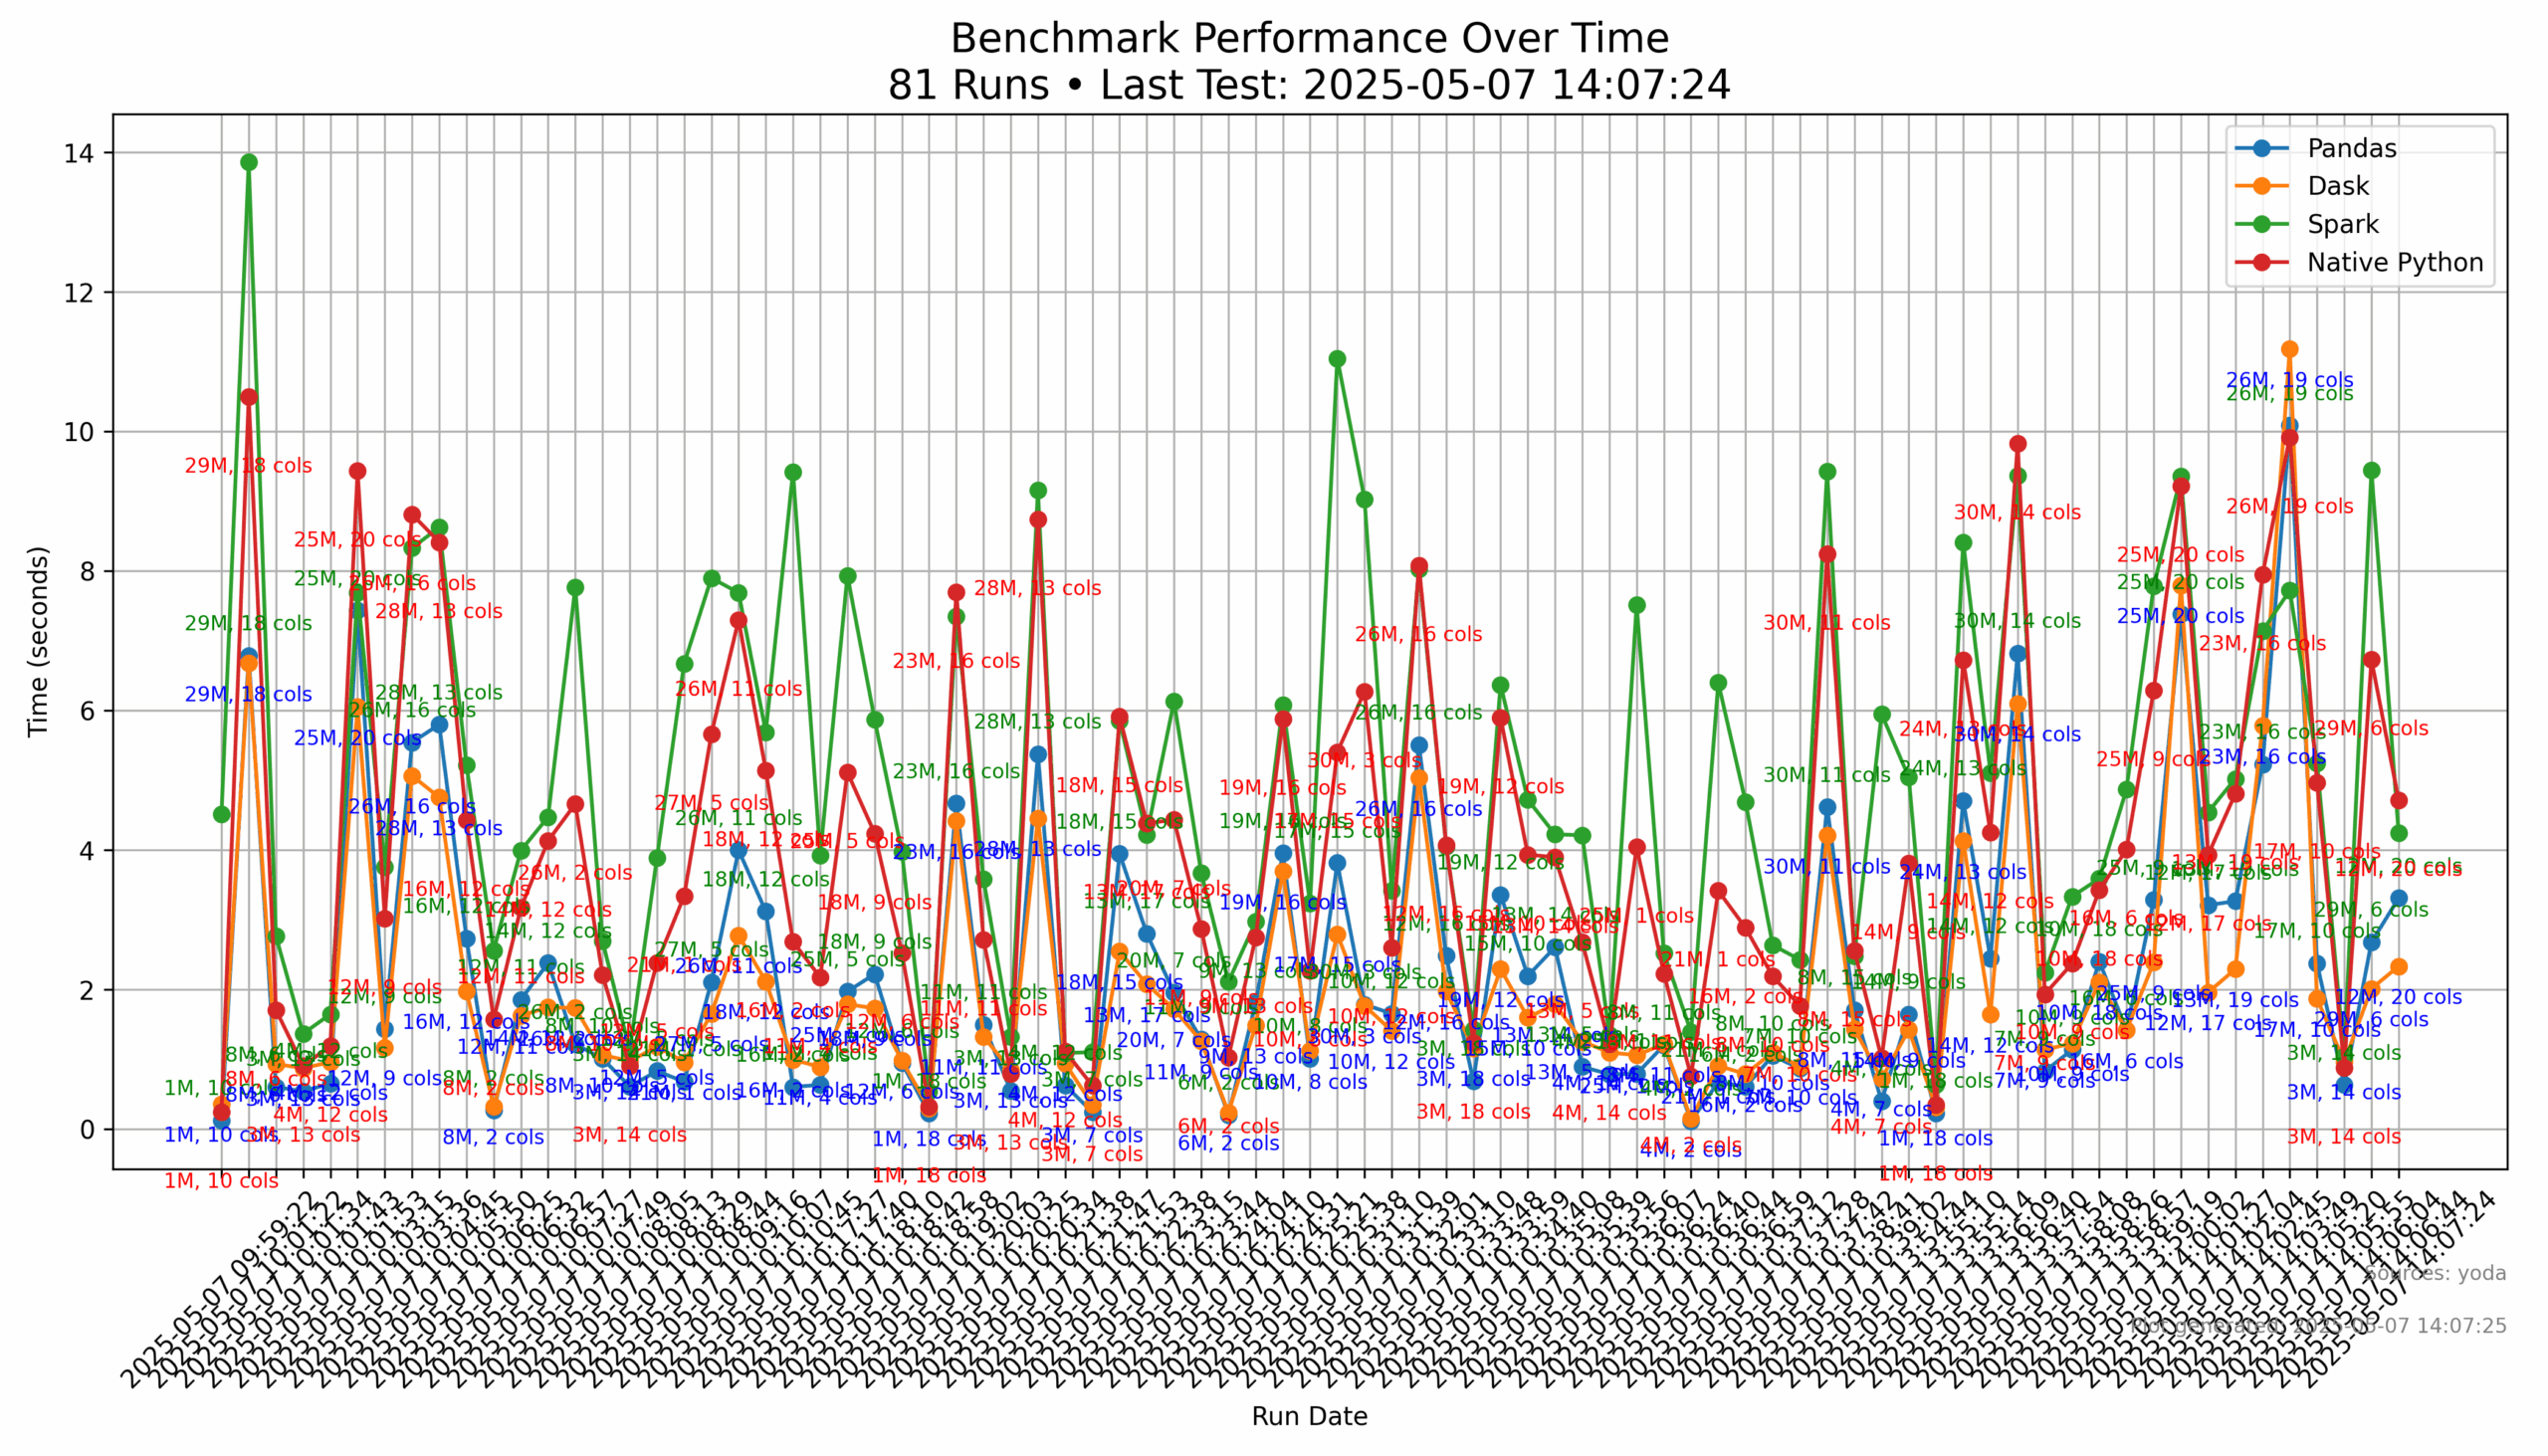
So I was not sure what the the results would be. I was a bit shocked that pyspark was typically the slowest method while dask and pandas flip flopped being the quickest. Now there are several reasons for this.
Pyspark has a significant amount of overhead, especially doing datasets this small. I did have to tweak the configs on the pyspark session since I kept getting memory errors that would crash the script. I imaging that if i ran this with millions of rows rather than capping at 3 million rows, it would probably be significantly faster. I image if I also could have chunked my data into sized partitions rather than a single large file would have enabled pyspark to take advantage of its multiprocessing abilities.
Dask was ran with a default config and not much tweaking. I could have probably sped it up by configuring it to better take advantage of its multiprocessing capabilities.
Pandas, almost always was one of the quickest options, regardless of file size. This is good to know since it was a basic pandas test with the native pandas mean function. This is good to know for future analysis runs that i can get reasonable results.
The native python tests typically werealways behind the pandas and dask benchmarks EXCEPT it did seem to compete with smaller data files where the other functions did not have time to soak the package overhead into the result time.
Below are two graphics. The first one shows the benchmark results in a graph from the local image that is generated for all data runs in that sqlite data base.
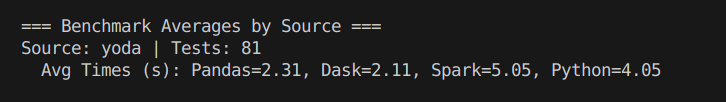
The bottom graphic shows the average time of runs that are stored in the Big Query database.
Where to Now?
This was a fun little project. I have a few todos to do with it. I want to update the Big Query database to add the source/hostname so i can track these results across different machines. I did run this script as a kaggle notebook and came up with similar results. I do plan on tweaking this so i can run it against different machines and track the results.
Thanks for reading. Please let me know if you see any fallacies in my logic, code, or methodology. I also would love to see what results your system produces with this code.